Desktop view of your store performance.
A centralised web dashboard that converts field photos into structured retail metrics. Monitor KPIs, track store compliance, and review performance across your entire network from a single screen.
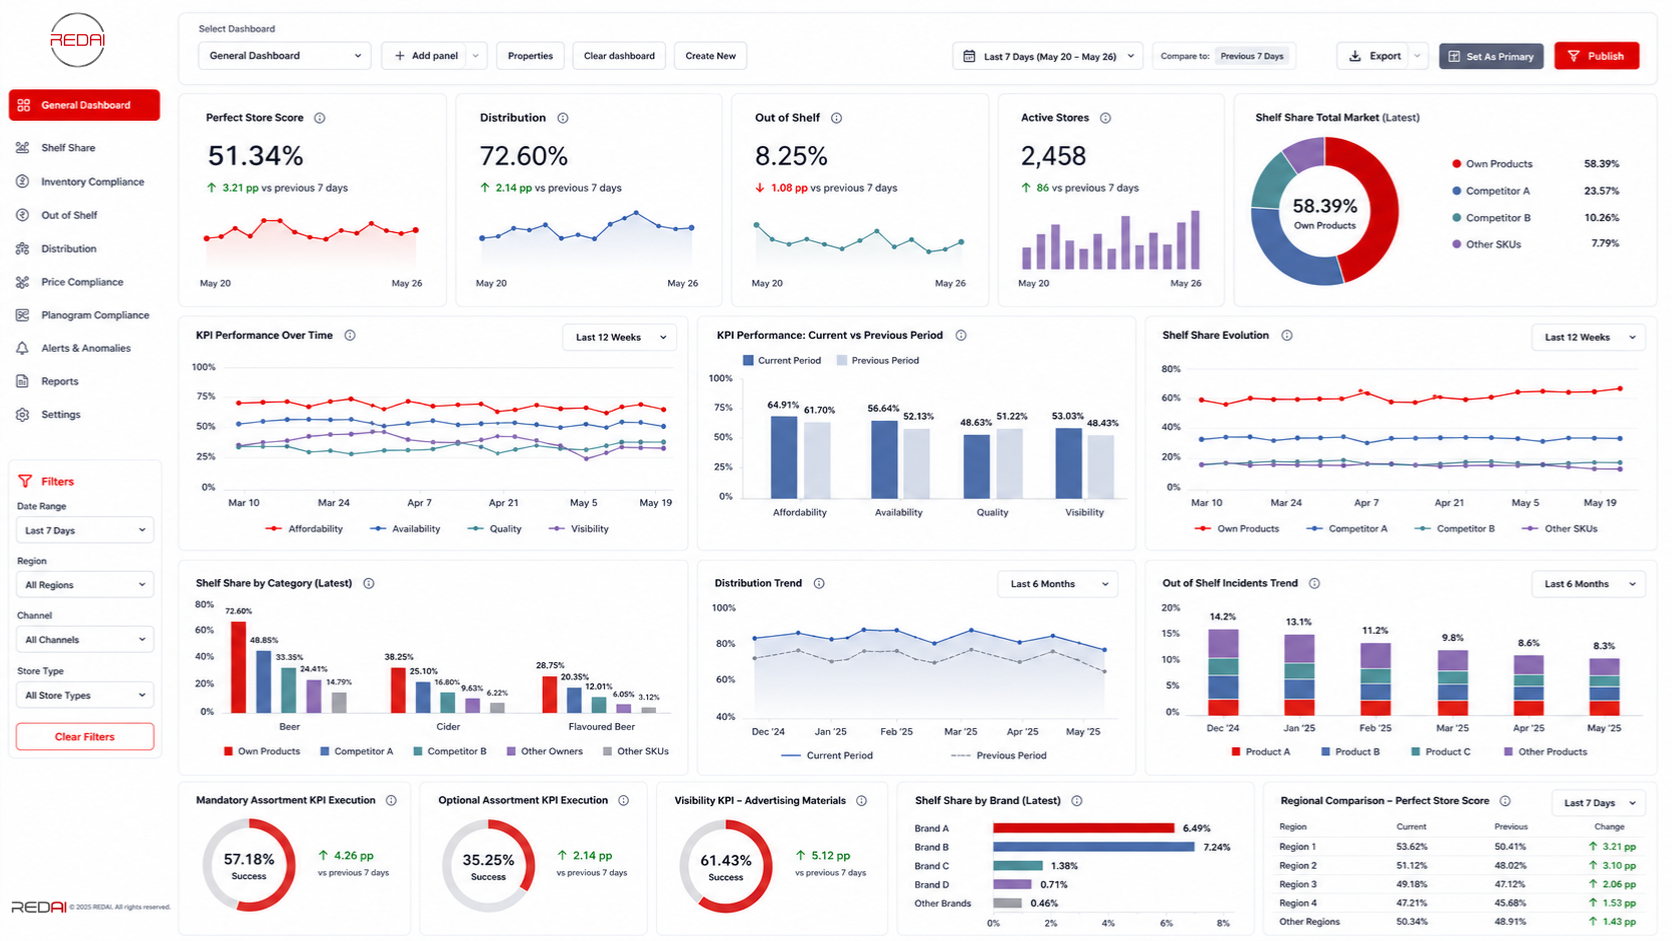
Manage store execution from a central interface.
Shelf images captured in the field don't just sit in a photo library. Each image is processed by REDAI's recognition technology and converted into structured data; ready to configure, monitor and report on from one interface.
Configure KPIs
Set clear objectives for retail execution: availability, compliance, pricing or share targets, and guide every team toward the outcomes that matter to your business.
Monitor network progress
Track daily execution data and store-audit results across specific locations, retail chains and regions; all from your office, without visiting field reports.
Identify trends
Access aggregated historical data to spot compliance patterns, seasonal variations and shifts in competitor shelf presence over time.
Straightforward reporting, built for your team.
Granular data views tailored for category managers, sales directors and trade marketing teams; each report answers a specific operational question.
Shelf share
Track your and competitor product's shelf presence by percentage, exact centimeter measurements, and first-facing count against competitors.
Price check
Monitor pricing across stores and regions to ensure competitiveness and catch unauthorised pricing deviations early.
Out of shelf
Keep a close eye on inventory levels at the shelf to prevent stockouts and avoid unnecessary overstocking.
POSM & promo verification
Track and measure the visibility and placement of contracted promotional materials and in-store displays.
Planogram compliance
Ensure products are displayed according to the planned layout and brand guidelines at every store visited.
Shelf gap detection
Detect empty spaces on the shelf to speed up replenishment, or identify opportunities to expand your brand's presence.
See where execution is heading, not just where it stands today.
Every shelf audit is stored against its store, region and category, so the dashboard isn't limited to today's snapshot. Compare any period against another and follow KPIs as far back as your data goes.
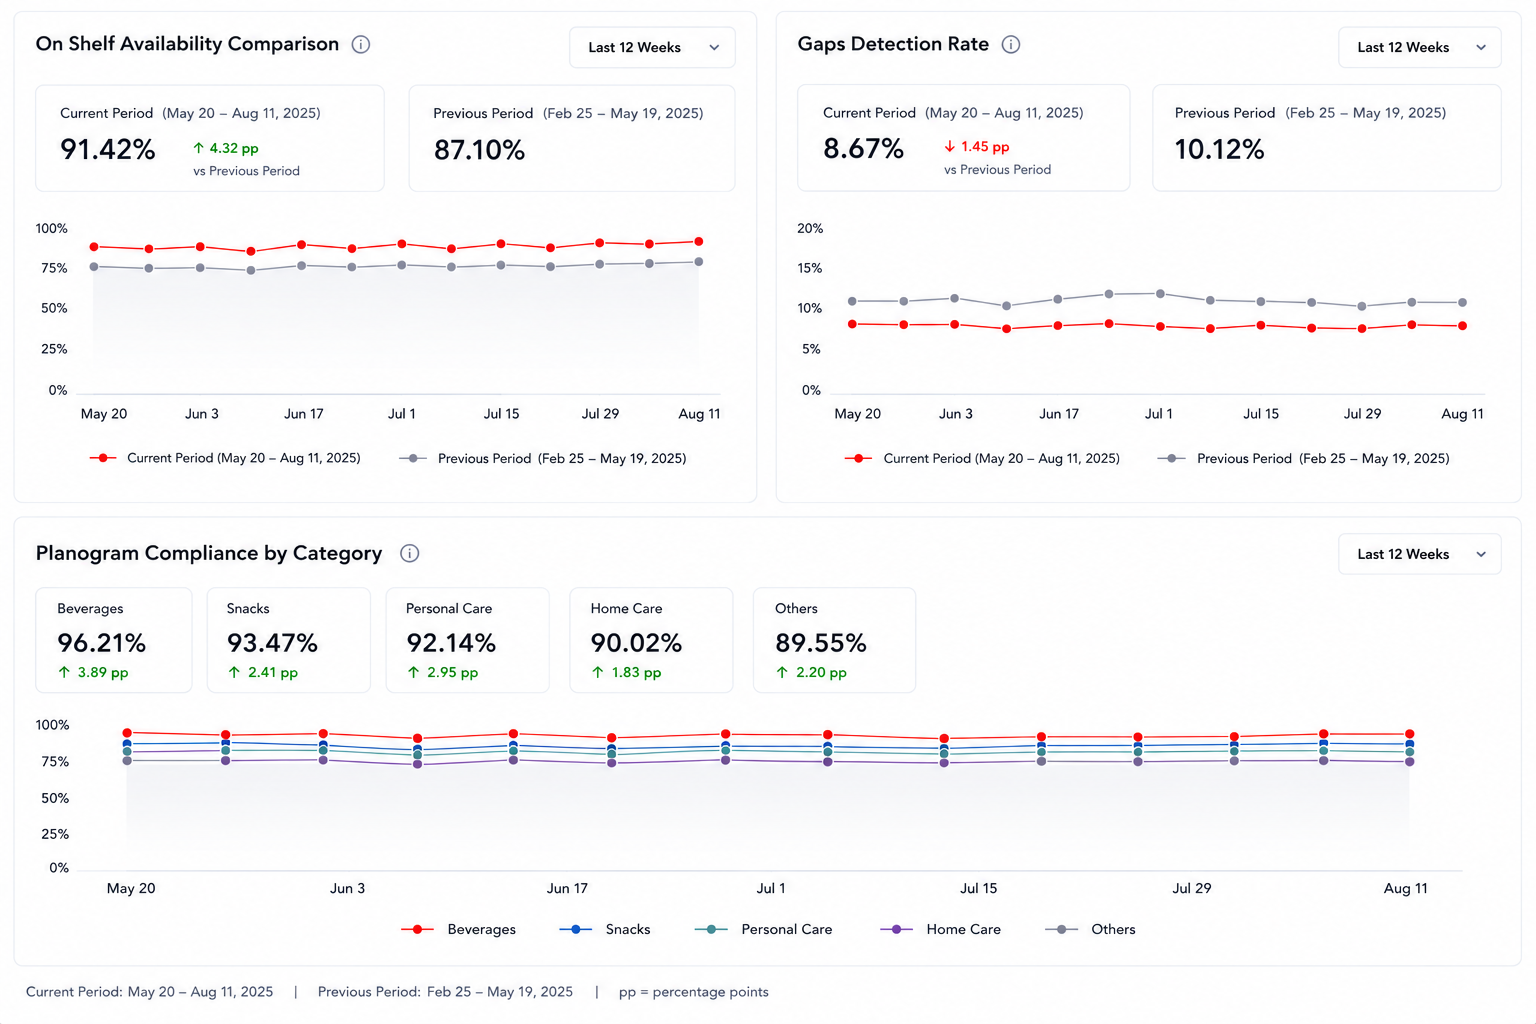
Historical data also surfaces competitor shelf movements. For example, a competitor's facing count increasing ahead of a promotional period in the same store last year.
Seasonal pattern detection
Spot recurring dips or peaks tied to holidays, promotions, or category seasonality across multiple years of data.
Store and chain-level history
Drill into any individual store's compliance history, or roll it up to chain and regional trend lines.
Custom period comparison
Compare any two date ranges — week over week, quarter over quarter, or year over year — for any KPI.
Functional tools for the management team.
Beyond reporting, the dashboard gives administrators and regional leads the controls needed to run a consistent retail execution programme.
Real-time web interface
Access up-to-date information the moment field teams upload data from store visits; no overnight batch processing or delays.
Targeted customization
Adjust KPIs, benchmarks and performance targets for specific stores, chains or regions to reflect local commercial priorities.
Role-based access
Manage user permissions to grant the appropriate access level to administrators, country managers or regional supervisors.
Scheduled reports
Configure automated reports to be generated and delivered to your inbox on a daily, weekly or monthly schedule.
One-pager dashboard
Review high-level KPIs and performance overviews aggregated on a single screen for fast, high-level assessment.
Data export
Export charts, tables and raw datasets into Excel, CSV or PDF formats for internal reporting and further analysis.
The right data, to the right person, on schedule.
Role-based permissions and automated delivery mean every stakeholder sees exactly what they need without manual report building.
Connect with the systems you already use.
A cohesive IT landscape matters. REDAI integrates with the systems already running your business, so retail execution data flows into the tools your teams use every day, rather than living in a separate platform.
ERP systems
Sync inventory and pricing data to keep shelf-level insights aligned with back-office records.
CRM platforms
Connect store-visit data to account records, so sales teams see execution history alongside customer context.
Open API access
Build custom connections to internal tools and BI systems using REDAI's documented API.
See your network's execution on one screen.
Get a centralized view of shelf compliance, KPIs and store performance built for the teams that turn field data into decisions.